
We applied the "Jobs to be Done" theory and "Customer Progress Design" methodology from unipro solutions to better align our product development process with the needs of end customers. We develop products with a focus on sustainability and circular economy (C2C) and by applying the methods we have learned what our customers demand and how we can help them to achieve it.
Markus SteckhanChief Strategy Officer WIK – ELEKTROGERÄTE Entwicklungs- und Service-GmbH & Co. KG 
Using the Jobs to Be Done approach has provided us with the insights we needed to focus our strategic measures where the benefits for our customers and our company are greatest.
Farkonda HaschemzadaSenior Director Corporate Strategy & Digitalization at Fraport AG 
Customer Progress Design allows the essential aspects of market research to be translated into a target-oriented and user-friendly concept. In addition, it ensures that the insights gained are used consistently and sensibly to align all levels of objectives of a customer-oriented company, from the mission to operational planning
Prof. Dr. Dennis AlbertProfessor for Marketing Management and Innovation at Wiesbaden Business School 
The Customer Progress Design method helped us uncover the unmet needs of our target customers, without being distracted by our own biases. This approach helped us to “feel” the customer’s pain, discover great new product ideas and reprioritize our existing ideas.
David A. Bell, Ph.DChairman and CEO GrandCare Health Services, LLC 
We learned about the Customer Progress Design method as a systematic approach to developing a customer-centric strategy. We have been able to experience how this method can be used to effectively experience and map the reality of customers' lives. We can use these insights to develop product, marketing and sales concepts that bring real added value to our customers.
Ingo FuchsExecutive Director Remmers Group 
Our client expected Safari Consulting to provide recommendations for more effective marketing messages. With the Customer Progress Design method we achieved this goal systematically, customer-centered and fast. Along the way, we were able to deliver approaches for new strategies.
Stefan HochManaging Director Safari Consulting 
I don't know of any method that can get me faster to crucial customer insights.
Stephan AbelerConsultant for customer-centric transformation and COO of cxomni 
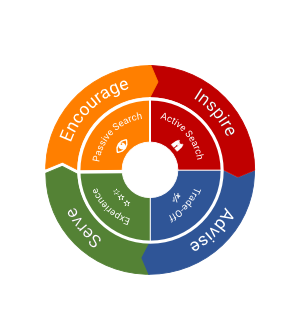
The jobs-to-be-done theory helps us to understand our customers better and to improve our products in a customer-centric way. In particular, the "Wheel of Progress" offers companies the opportunity to change their perspective. The Jobs theory approach holds great potential for companies.
Andreas KnuhrTeam leader of the Thuringian agency for skilled labor 
As a digital agency, DUMBO uses "The Wheel of Progress" to structure interviews and identify "Jobs-to-be-done". This way, we enrich our design process with a mental model that helps us gain qualitative insights repetitively and reliably without losing flexibility.
Robert GoeschCo-Founder & Managing Director DUMBO GmbH 
The structured customer research process based on The Wheel of Progress accelerates the time to turn the input from customers into actionable insights to improve the customer journey.
John GusiffChief Experience Officer, Customer Centric Solutions LLC 


